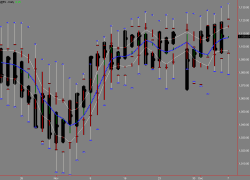
To be perfectly candid, there is very little objective, explicit evidence available to support the commonly accepted rules of chart analysis, yet the rules are widely accepted as valid and in many instances seem to produce worthwhile results. Chart signals are given by patterns built on many days’ price activity, which are often extremely difficult to define mathematically. This means that the chartist is essentially performing a highly complicated and subjective multiple correlation analysis in his mind as he examines his chart. When technicians attempt to focus attention on short-term fluctuations they leave themselves open to criticism. However, nearly all market analysis is based on short-term analysis, as an attempt-is made to find the appropriate moment to execute prices. The use of medium to long term price analysis will not take into account a random walk of a market on a medium to long term basis and the unpredictability of prices. Price is a result of a cause/effect relationship and occur at the wiggle of fingers in a trading pit. To assume an execution of a trading position based on medium to long term chart analysis does not take into account the effective impact of the character of the market as it relates to news events, trader’s commitments (who’s buying/selling), market psychology and other short term, small time-span factors. Fundamental analysis is the only justifiable approach to long term price analysis.